Needing more than a spark test?

The offset and noise floor of the signal conditioning circuit look OK so I may have lucked out. But I'll check to see if I have any more LMC662's I can swap in. I also may have a lower-noise alternative, although I don't think that would make much of an improvement -- the largest gain is right up front in the amplifier chain.
I would not use LMC622 there. Try for something else. The package is one of those tiny things. I know.
Go ahead, and change the Rf down to something sensible. Even 1MΩ is way high. There are at least a couple of places where you can have gain easier to apply. One is on the Pocket Geiger board, and it has x100. This should give you a working TIA, and you have place on your signal conditioner to take it up to anything you need.

Reducing the Rf may mean it oscillates, but that is stopped by increasing Cf. I would be surprised if more than a couple of pF is needed. I think it should be OK.
Regarding the relatively low pulse amplitude, given the large overall gain, has me wondering if perhaps there's a problem with my pocket geiger -- the detector or maybe even an incorrect component value. It will be good to see what results other folks get with a similar setup. FWIW, the pocket geiger's voltage divider string establishes a +200mV detection threshold on comparator U3B, relative to U1's common signal "ground".
The 10MΩ with 1uF low pass at the at the input to the conditioner board has a frequency roll-off frequency that seems way too low - like about 16 milli-Hertz. I would change the capacitor to (say) 100nF, and disconnect the resistor.
However, I do occasionally see pulses that are _much_ larger in amplitude. They show up regardless if I have the Am241 sources present or not so they have to be from the environment or are cosmic rays.
The occasional "big" pulse could very well be the 1/f shot noise that will happen.
 
The offset and noise floor of the signal conditioning circuit look OK so I may have lucked out. But I'll check to see if I have any more LMC662's I can swap in. I also may have a lower-noise alternative, although I don't think that would make much of an improvement -- the largest gain is right up front in the amplifier chain.

Regarding the relatively low pulse amplitude, given the large overall gain, has me wondering if perhaps there's a problem with my pocket geiger -- the detector or maybe even an incorrect component value. It will be good to see what results other folks get with a similar setup. FWIW, the pocket geiger's voltage divider string establishes a +200mV detection threshold on comparator U3B, relative to U1's common signal "ground".

However, I do occasionally see pulses that are _much_ larger in amplitude. They show up regardless if I have the Am241 sources present or not so they have to be from the environment or are cosmic rays.
My unit won't arrive until midweek, if I believe FedEx. So I won't have anything physical to work with.

I can't even get Graham's spice file to simulate. Maybe tomorrow I will simply recreate the schematic from scratch and add the model a different way. For some reason LTspice doesn't like his file. For all I know it is a locale problem that shows up in an absurd way.
 
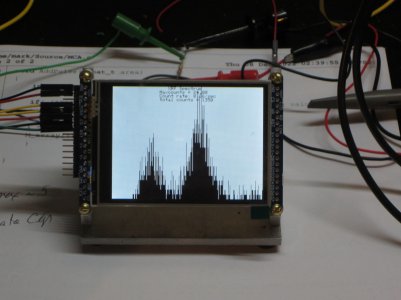
Here's a spectrum acquired after I increased the gain of my signal conditioning board. I have found that the amplitude of the noise peak can be reduced by specifying a lower acceptable RMS error from my curve fitting routine. The error is scaled by the peak voltage so it should apply equally well to low-amplitude pulses and higher amplitude pulses.

No filtering has been applied, this is the raw output from my MCA. Heavy filtering may screw up options for de-convolving overlapping peaks so making the spectrum look nicer may not really improve the overall performance, in terms of figuring out what steel alloy you're looking at.

This spectrum was acquired using a piece of 1018 HRS.

Steel 60X gain.JPG
 
Making the fit-error parameter even tighter did some things that have me thinking that my code is introducing some kind of bias in the pulse statistics. I'm seeing what appear to be multiple peaks in the energy distribution. Just not realistic, considering the sample is basically pure iron. The other downside is that the effective count rate is really low so not really practical for quick evaluation of alloys in a scrapyard situation.

Maybe the strange energy distribution problem is due to the fact that the pulses are NOT gaussian. A fast current pulse into a TIA whose feedback resistor is shunted by a capacitor will exhibit a fast-rise followed by a slower decay type of waveform. The fast rise is due to the fast current pulse from the PIN diode, basically charging the capacitor in the TIA's feedback network according to the equation Q = CV....rearranging, V = Q/C (i.e., it behaves like a charge amplifier). After that the parallel RC combination causes a slower decay. Not Gaussian.

That said, I really don't understand the appearance of those multiple peaks. Not yet, anyway. I noted similar features earlier when my setup wasn't able to take full advantage of my Teensy4.0's ADC dynamic range (best-case, 12 bits), and that's one of the main reasons I increased my signal conditioning board's gain by a factor of 6 -- but there they are, the same kind of wonky peaks.
 
Is it closer to a Raleigh distribution? Or more like the impulse response of a low pass filter?

Can you explain for us what is being displayed? Are these qualified integrated pulses sorted by energy bins and then accumulated pulse by pulse? How you qualify the pulses could very well bias things, but I don't understand the current method being used. In a way the algorithm is trying to be Maxwell's daemon sorting out pulses.
I think the distribution should be pretty close to Gaussian, at least for a single element. The shape isn't the result of a filter, it's the detection statistics. That's why the energy resolution of scintillator crystals is in terms of FWHM. The best scintillators have an energy resolution around 3%, normally tested at 662Kev.

Regarding your questions on my MCA stuff, the horizontal axis is integrated pulse area and the vertical axis is # of occurrences. The code is dead simple (attached, but I had to change the file type). It basically clips and scales input data so it can be plotted on my TFT display.

Regarding the pulse qualification aspect, I know that my code is rejecting pulses. I use several pulse-qualification "filters", with the curve-fitting error being just one of them. I also reject pulses if they are too short or too long. If the pulse is shorter than what I expect the detector/amplifier/filter chain to generate when an xray photon passes through, maybe it was generated by some other mechanism (? but see below). If the pulse is too long, that's probably due to pulse overlap, which will mess up the integrated pulse data.

Since the output pulse shape is almost completely determined by the TIA's RC time constant and the filtering done by the next stage, just about any kind of input event would produce a pulse that looks right. So at this point I'm not sure if the short-pulse rejection is helping or hurting.

Another experiment I haven't tried yet is to enter pulse peak values into the MCA rather than the pulse area. I expect it to be even noisier but that's just a hypothesis at this time.
 

Attachments

  • MCA.txt
    2.6 KB · Views: 3
If anyone is interested in playing around with the SiPM + scintillator approach, I have discovered a line of BGA-packaged SiPMs for about the lowest price I've seen yet. A 6mm x 6mm AFBR-S4N66C013 from Mouser costs $58.44. A 4 x 4 mm (.....S4N44..) is $31.06. Their 3 x 3 mm (....S4N33..) is $25.03. All in stock

The ball pitch is just under 1mm so I think it should be possible to solder these using ye olde toaster oven method. An alternative would be to use conductive silver-loaded epoxy but it has a limited shelf life if not stored in a refrigerator or freezer. In either case my PCB would include some silk-screened alignment marks to make it easier to accurately place the part where it needs to be w/o risking a short between the solder balls. I've done this for QFN style packages and it worked pretty good.

About a year ago Broadcom bought the SiPM business from Ketek. I had looked at the Ketek devices earlier & couldn't figure out why they disappeared from the Ketek web site. FYI, Ketek has a whole line of (expensive) silicon detectors for X-ray spectroscopy. I guess they decided they didn't want to sell the individual pieces.
 
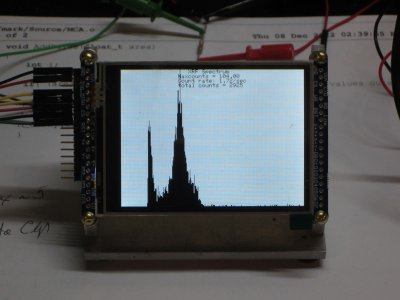
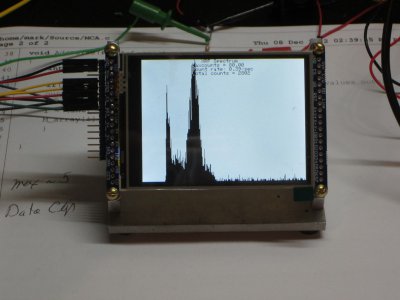
I modified my code to enter the fitted peak value and acquired two spectra, one for aluminum and one for zinc (that's one of the elemental standards I got in my set). They lie on either side of the energy range for our ferrous alloys. Unfortunately, I'm not seeing much of a difference in the MCA plots. I know my system is acquiring pulses from samples because the count rate drops to well below 1CPS with no sample in there.

That said, there are some differences in the shape of the two spectra but they don't jump out at you much. Maybe other folks will see something I don't.

Aluminum:
Aluminum.JPG

Zinc:
Zinc.JPG

The pulse area values should have a much better SNR so I'm going to go back to plotting that to see how things look. BTW,I noticed that pulses were clipping a lot more when I increased the gain of my signal conditioner to 60. So these plots were acquired with the 10X setting.

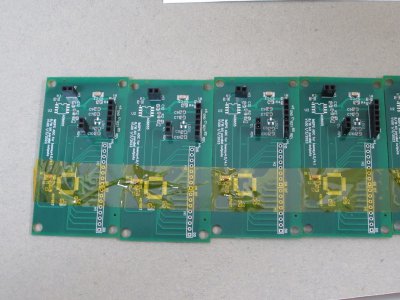
And now for some good news: my ADC boards arrived today! I need to add a few components & then I get to write some driver code to test it out....

ADC boards.JPG
 
Are the peak counts in the same bin? Kind of hard to tell. Maybe truncate the higher bins so we can tell easier? It would spread the peaks apart. They are subtly different but wow, going to be interesting to separate things.

Where should there be lines or peaks and how does your measurement compare? Could you do an overlay with expected signature? Trying to figure out if the return is elemental or clutter from an unknown source.
The problem is that the different elemental references pretty much look the same. Makes it hard to calibrate the setup, particularly when using a detector that may not have been designed to be used as an energy-dispersive detector.

I've done some troubleshooting on my signal conditioning board. Based on the DS for the LMC662 I didn't think that it should be clipping at a 2.5V output -- it should be able to go much higher than that, particularly with a +10V power supply. I verified the clipping problem by driving its input with a signal generator, so it's starting to look like I probably damaged the amplifiers on the board. I'm going to replace them with some better amplifiers, the ADA4177. It can handle +/- 18V supplies, and has much better noise performance -- 8nV/sqrt(hz), compared to 22nV/sqrt(hz) of the LMC662.
 
Back
Top