A lightweight temperature monitoring solution

Ubuntu Server 22.04 is considered fairly safe, but there is still a couple of good hardening practices we should implement just in case.

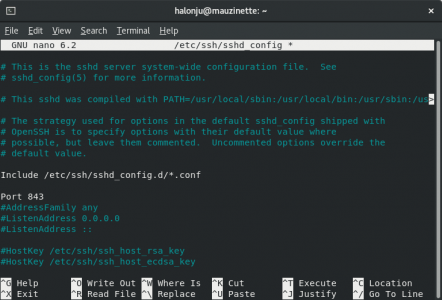
First we'll change the default SSH port to 843, as we don't want to assign it to an unprivileged port (≥1024). Let's make a backup of the configuration file and edit it using nano...
Bash:
$ sudo cp /etc/ssh/sshd_config /etc/ssh/sshd_config.bak
$ sudo nano /etc/ssh/sshd_config

00b.png

...and while we're at it, we should also disable root login and save the changes:
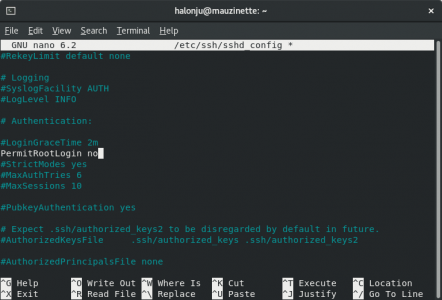
00c.png

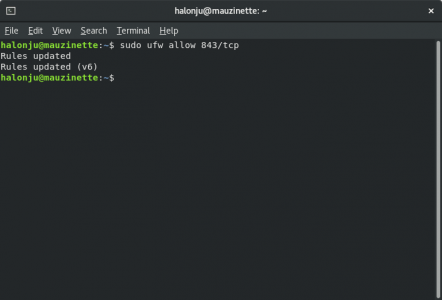
Next we'll configure the firewall to allow incoming connections to port 843:
Bash:
$ sudo ufw allow 843/tcp

01a.png

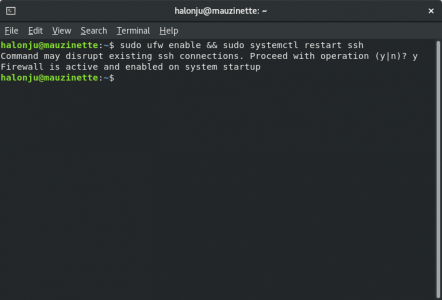
Then we'll enable the firewall and restart the ssh service.
Bash:
$ sudo ufw enable && sudo systemctl restart ssh

01b.png

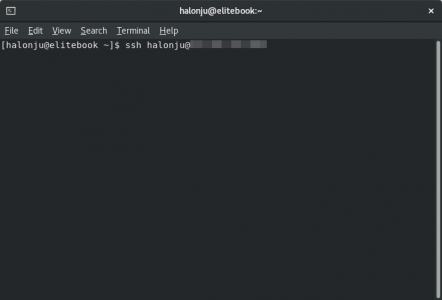
Now if we try to reconnect using the default SSH port, the connection gets refused:
02c.png

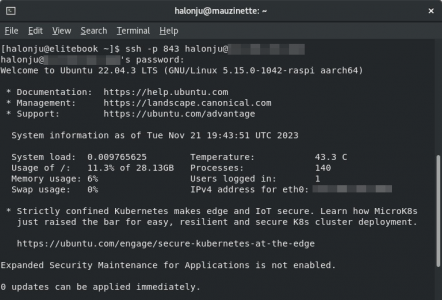
To successfully establish an SSH connection, we need to specify the port using the -p option flag:
Bash:
$ ssh -p 843 halonju@***.***.***.***

02d.png
 
Last edited:
I spotted a few failed SSH login attempts in /var/log/auth.log. The odds that some **** would manage to brute force their way into the system are low, but let's implement fail2ban just in case :boxed in:

We'll start off by updating package lists and installing fail2ban:

Bash:
$ sudo apt update && sudo apt install fail2ban

Then we'll create a configuration file for fail2ban using nano...

Bash:
$ sudo nano /etc/fail2ban/jail.local

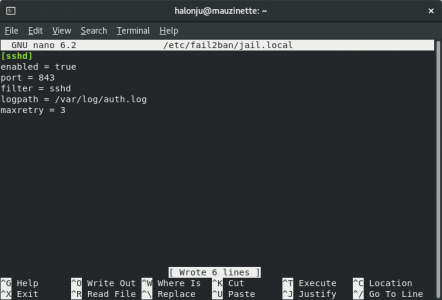
...containing the following:

Code:
[sshd]
enabled = true
port = 843
filter = sshd
logpath = /var/log/auth.log
maxretry = 3

f01.png

Now all there is left to do, is to enable and start the service:

Bash:
$ sudo systemctl enable fail2ban --now
 
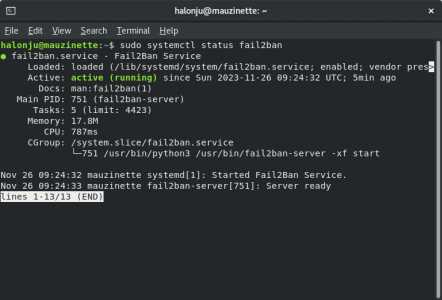
I've rebooted the system and wanted to make sure that fail2ban has been started by systemd. We can easily check this using the systemctl command:

Bash:
$ sudo systemctl status fail2ban

The output looks good :encourage:

g00.png

In case you manage to jail yourself, just log into the RPi using a physical keyboard and unban your IP address using:

Bash:
$ sudo fail2ban-client set sshd unbanip ***.***.***.***
 
It's finally time to collect some data from the RuuviTag :excitement: To achieve this, we'll use the lightweight, 100% written in Rust ruuvitag-listener client by Ville Lautanala.
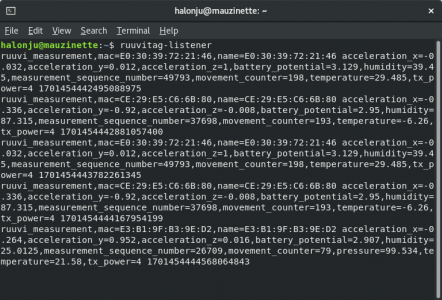
We'll start by downloading and extracting the ruuvitag-listener binary into /usr/local/bin:

Bash:
$ wget https://github.com/lautis/ruuvitag-listener/releases/download/v0.5.5/ruuvitag-listener-v0.5.5-aarch64-unknown-linux-gnu.tar.gz -O - | sudo tar -xz -C /usr/local/bin/

Then we'll allow the binary to access Bluetooth:

Bash:
$ sudo setcap 'cap_net_raw,cap_net_admin+eip' `which ruuvitag-listener`

Now, let's give it a go:

Bash:
$ ruuvitag-listener

000.png

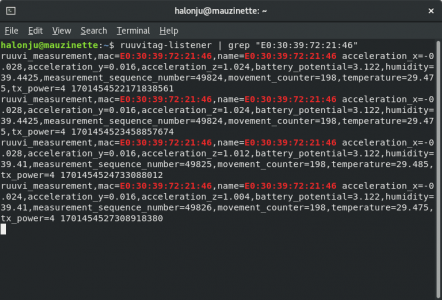
It works, but as you may notice, there are multiple RuuviTags nearby. All of them are mine, but let's filter out the ones that aren't going in the shop:

Bash:
$ ruuvitag-listener | grep "E0:30:39:72:21:46"

001.png

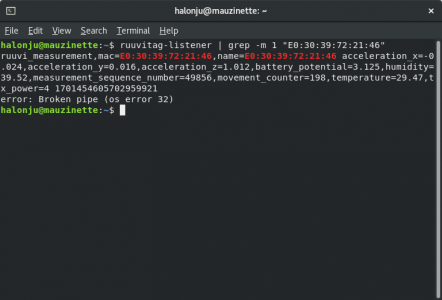
The command will run indefinitely, so we'll make it terminate after the first read:

Bash:
$ ruuvitag-listener | grep -m 1 "E0:30:39:72:21:46"

002.png

Now it's way better, but we really want to get rid of the annoying error message at the end. Let's direct that to /dev/null:

Bash:
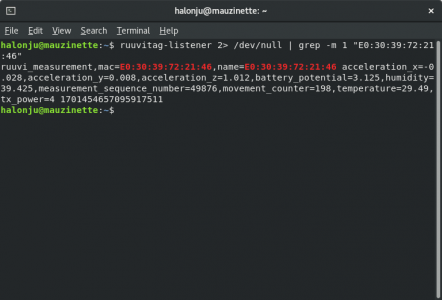
$ ruuvitag-listener 2> /dev/null | grep -m 1 "E0:30:39:72:21:46"

003.png

A timeout will save us a headache, in case the RuuviTag is out of reach for any reason:

Bash:
$ timeout 60 ruuvitag-listener 2> /dev/null | grep -m 1 "E0:30:39:72:21:46"

Now all there is left to do, is to direct the output to a file. Let's first make directories for both the project and it's data in /srv:

Bash:
$ sudo mkdir -p /srv/shopmon/data

A dedicated user group will come in handy later on:

Bash:
$ sudo groupadd shopmon

Let's change the directory permissions so that the directory is accessible to the users in the freshly created group:

Bash:
$ sudo chown -R halonju:shopmon /srv/shopmon
$ sudo chmod -R 775 /srv/shopmon

Now we should be able to write the output to a file...

Bash:
$ timeout 60 ruuvitag-listener 2> /dev/null | grep -m 1 "E0:30:39:72:21:46" >> /srv/shopmon/data/data.log

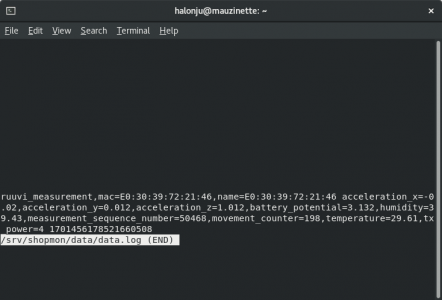
...and read it using less:

Bash:
$ less /srv/shopmon/data/data.log

004.png

Note that we use >> instead of > when directing the output to a file, so that any existing lines won't get overwritten with the new data.

In the next update, we'll set up cron and create a cron job for scheduled data collection :geek:
 
Last edited:
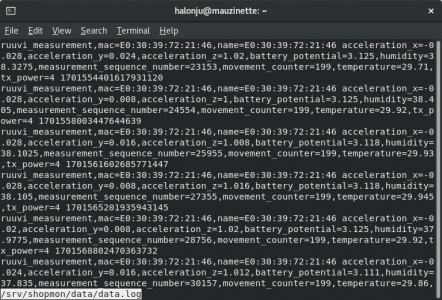
It's time for yet another update on this project! As promised in the previous post, in this update we'll set up cron and create a cron job for scheduled data collection. Before we'll get into that, let's clear the data we have previously output to the log file:

Bash:
$ rm /srv/shopmon/data/data.log

Now we'll create an unprivileged user to run the cron job as...

Bash:
$ sudo useradd -s /sbin/nologin cron

...and add it to the shopmon user group:

Bash:
$ sudo usermod -aG shopmon cron

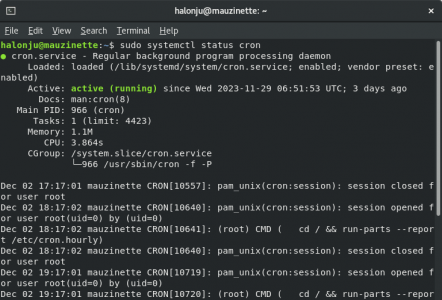
In Ubuntu Server 22.04, cron is enabled by default. We will confirm that the service is running using systemctl:

Bash:
$ sudo systemctl status cron

001.png

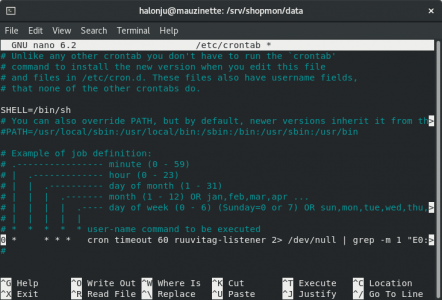
The service is running and we can see there are some default jobs running hourly. The next thing is to edit the crontab file to schedule the data collection from the RuuviTag using the command...

$ timeout 60 ruuvitag-listener 2> /dev/null | grep -m 1 "E0:30:39:72:21:46" >> /srv/shopmon/data/data.log

...from the previous post. We'll do this using nano:

Bash:
$ sudo nano /etc/crontab

002.png

After saving the changes, all we have to do is to wait for a good while and come back to see if there is any data logged...

Bash:
$ less /srv/shopmon/data/data.log

003.png

...and yes there is! Great success :encourage:

We have now successfully set up the data collection from our RuuviTag and in the upcoming updates, we will be focusing on presenting the collected data using R and Quarto.
 
in the upcoming updates, we will be focusing on presenting the collected data using R and Quarto.

Looking forward to it. I have a Linux system that does basic server stuff and also handles temperature logging with rrdtool.
 
Just a thought. I'm sure you have data plotting tools available. The one I've really come to like is KST plot. It's cross platform, and does a really nice job looking at long files. Even live ones, so you get real time updates.

I've plotted well over a years worth of 1 sample per second temp, pressure, humidity data with it. Admittedly, it does struggle a little with 32M lines over a network, but if you're patient it can get the job done.

Little bit of a learning curve, but not bad enough that I really ever cracked the manual open.

Indeed, there are many OOB solutions out there for temperature logging. I would've used Elastic Stack if I did this for something else than for my own entertainment :geek:

I'm recording the data hourly, so 32 million lines with a single sensor would equal to a few centuries of data logged.
 
I've been logging data for a few weeks in the lab once a second. Hourly would be meaningless. Every second is a bit overkill, but easy to do. You might be surprised what you can learn of you log at high rates. For example, I can see the temp change when I enter or leave the room.

I'm slowly working on a temperature controller for that space. With HVAC running in the rest of the building, this is on the tail end of everything and I'm trying to understand exactly how tightly the temperature can be controlled with no input to the heating system. Just parasitic use of the ductwork with a motorized damper on one heating vent.

Right now, it's able to hold temp to about +/- maybe 1/4 to 1/2 degree F. Not sure what will happen in summer, with AC running, tho.
 
It's been a while since I last updated the thread. I caught the seasonal flu and this year it was really bad.

In this update, we'll install R and Quarto to present the collected data. Since there is no up-to-date R binary available for ARM, we'll have to install it from the source. We will do this according to this fantastic step-by-step guide by Posit:

Install R from Source

After R has been successfully installed, it's time to install Quarto using another brilliant guide from Posit:

Download and install Quarto using .tar.gz file

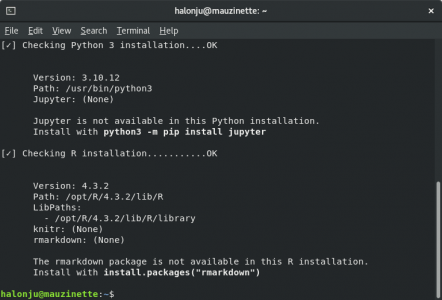
Now if we run...

Bash:
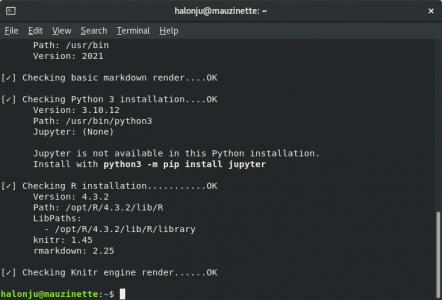
$ quarto check

...Quarto should find the R installation :encourage:

001.png

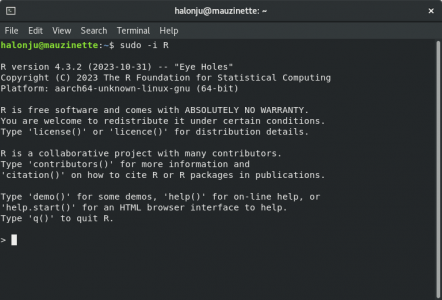
The next thing we'll do is install the knitr and rmarkdown packages. To achieve this, we'll have to open the R console with root privileges using...

Bash:
$ sudo -i R

...and it should look like this:

002.png

To install the package, run...

Code:
install.packages(c("rmarkdown", "knitr"))

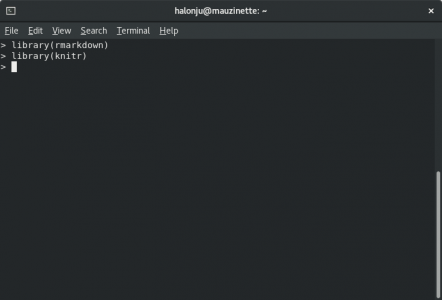
...after which R will prompt you to select a mirror. I'll use "34: Marseille, France [https]" a.k.a. biotools.fr, but feel free to use whichever is the closest to you. Allez L'Om! To make sure that the packages load without errors, run...

Code:
library(rmarkdown)
library(knitr)

...which should result in no output...

003.png

...then exit the console using:

Code:
q()

There is no need to save the workspace at this point. Now all there is left to do is to run...

Bash:
$ quarto check

...again and check that Quarto finds both the knitr and the rmarkdown packages:

004.png
 
Last edited:
Back
Top