A lightweight temperature monitoring solution

Before proceeding into installing the web server, we'll install one more package (or a collection of packages to be precise) in R, Tidyverse. Tidyverse has some dependencies (e.g. rvest) which require the libxml12-dev package, let's install it using:

Bash:
$ sudo apt install libxml2-dev

After this we'll open the R console with root privileges using...

Bash:
$ sudo -i R

...and we should be able to install Tidyverse using:

Code:
install.packages("tidyverse")

Once again R will prompt us to select a mirror. I'll use "34: Marseille, France [https]" as usual, but feel free to use whichever you like. After the installation is complete, check that the library loads without errors by running:

Code:
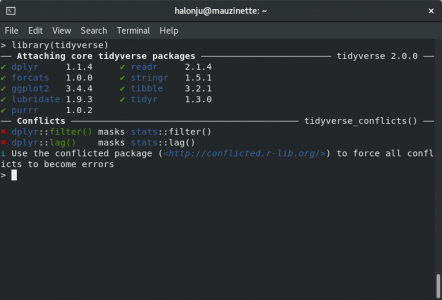
library(tidyverse)

The output should look like this:

001.png

Now all there is left to is to exit the R console by running:

Code:
q()

There is no need to save the workspace this time either :geek:
 
Last edited:
In this update, we'll install the web server. On RPi, nginx is the way to go as Apache is quite resource-hungry. Let's start by running both...

Bash:
$ sudo apt update

...and...

Bash:
$ sudo apt upgrade

...reboot if needed. After we have brought both the package lists and the packages itself up to date, we can proceed into installing nginx. To install nginx, run:

Bash:
$ sudo apt install nginx

The nginx service will be enabled by default, now all there is left to do is to configure the firewall to allow traffic to port 80. This can be done using:

Bash:
$ sudo ufw allow 80

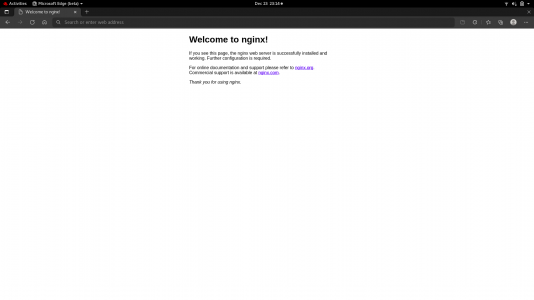
Now, navigate to your ip address using your browser, et voilà:

001.png

Merry Christmas to all HM'ers!
 
Last edited:
Happy new year H-M!

In this update we'll write a simple Quarto markdown document to read the collected sensor data. For now, it will only output the line count of the data.log file, but once we have the document rendering pipeline up and running, we can start adding complexity (i.e. features) to the code :encourage: Let's start by creating an empty file called shopmon.qmd in path /srv/shopmon using nano...
Bash:
$ nano /srv/shopmon/shopmon.qmd

...and by pasting the following code in it:

Code:
---
title: "Shopmon - Jussi's Lightweight Temperature Monitoring Solution"
format: html
editor: source
---

```{r}
#| label: load-packages
#| include: false

# Load the Tidyverse library
library(tidyverse)
```

```{r}
#| label: read-data
#| include: false

# Read the collected monitor data
data_raw <- read_csv("/srv/shopmon/data/data.log", col_names = FALSE)
```

```{r}
#| label: display-statistics
#| echo: false

# Output the number of lines in file data.log
cat(nrow(data_raw))
```

After pasting the code, write out the changes and exit the editor. Now, before we can render the document, we will have to change the permissions for nginx's default path /var/www/html/ using chown:

Bash:
$ sudo chown -R halonju:shopmon /var/www/html/

At it's current development stage, Quarto struggles with absolute paths. To avoid these known issues, we will first render the document into a temporary location and then move it to the nginx directory with mv:

Bash:
$ cd /srv/shopmon/ && quarto render /srv/shopmon/shopmon.qmd --output-dir html --output index.html && mv /srv/shopmon/html/* /var/www/html/

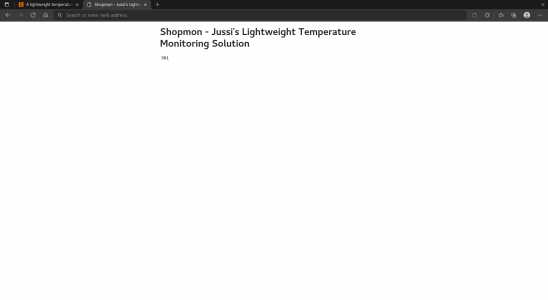
Now, if we navigate to the RPi's IP address, we should be able to see the rendered document:

001.png

Great success :encourage: In the upcoming updates, we'll further improve the code and create a cron job for scheduled document rendering.
 
Last edited:
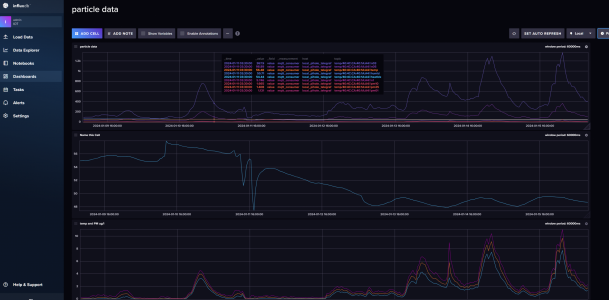
I'm using a esp32-C6 with a DHT22 for temp/humidity and a PMS7003 particle sensor for dust and air quality

For the data i'm usiing PicoMQTT on the esp32 and mosquitto in a linuxVM.
For data storage and visualization i'm using influxDB

you could run mosquitto and influxDB on the pi and use $5 esp32's to collect data from multiple locations.

here's what it looks like.

1705420663318.png
 
Looks good @greenail :encourage:

I've ran into a rather annoying feature with ruuvitag-listener. The issue is that whenever the value for movement counter resets from 254 to 0, the value is dropped from the output until the movement counter hits one. This completely breaks the log file, as the number of values per line varies over time. Now I'm considering dropping the value for movement counter entirely, as it is useless in this application anyway.
I very much dislike systems that have discontinuity in log files. Even the number of leading spaces or leading zeros can make scanning data harder by eye. Just dropping a value is unacceptable. This is where I usually start to grumble about programmers, and being lazy/sloppy, etc. I'll reserve that for another forum.

In general, I've found if reliability is necessary, roll your own software on your own hardware...
 
I've finally had time to look deeper into the issue :geek:

I will probably sort this out in R, instead of using a regular expression to drop the value for movement counter during data collection. This way if the behaviour gets fixed in a future update, I still have the original data and I can just fill in the missing values using Rainbow CSV, a fantastic extension for Visual Studio Code.
 
I've done this in the past, usually with a combination of off-the-shelf wireless sensor that is supported by rtl_433 and RPi + Grafana.

The nice thing about rtl_433 is you get the raw data that the sensor sends on the ISM bands so you can do whatever you want with it. With a good antenna I was able to pick up some sensors we had pretty far from the house(~400ft or so).
 
The issue is that whenever the value for movement counter resets from 254 to 0, the value is dropped from the output until the movement counter hits one. This completely breaks the log file, as the number of values per line varies over time.

Here's how the log file looks like in Visual Studio Code:

1706355448758.png

As you can see, a missing movement counter value causes the columns for temperature and transmit power to shift. To solve is issue, I wrote the following kludge to remove the movement counter data:

Code:
```{r}
#| label: read-data-kludge
#| include: false
#| eval: true

# Read the collected monitor data
data_raw <- read_lines("./data.log")

# Remove data for movement_counter
data_raw <- str_remove(data_raw, "movement_counter=\\d+,")

# Convert the character vector into a data frame
data_raw <- data.frame(data_raw)

# Split the data into columns and unify column headers with read_csv output
data_raw <- separate(data_raw, col = "data_raw", into = c(paste0("X", c(1:8, 10:11))), sep = ",")
```

It is written in a way that once this unwanted behaviour gets fixed, instead of refactoring the rest of the code, I can simply use the eval output option to switch between the preferred method of handling the collected data.
 
I’m sadly giving up on this project, or at least on the current approach :apologize:

First of all the movement counter value turned out not to be the only value that is intermittently omitted from the data which causes the rest of the columns to shift. This is clearly a more major issue with the ruuvitag-listener package, because this time we’re talking about non-null values :guilty: I contacted the developer a few weeks ago, but haven’t got a response.

An another big issue I’m facing is the filesystem, which on an RPi is rather prone to breaking. If I at some point decide to give this approach an another go, I will definitely follow Chris Dzombak's advice for a long-running Raspberry Pi.

Thanks,
Jussi
 
Back
Top